Building A Log Platform On ClickHouse And GKE
A small log platform on GKE: OpenTelemetry, ClickHouse with two replicas and three Keepers, a GCS cold tier and HyperDX. How it is built, why each part is there, and what the numbers looked like.
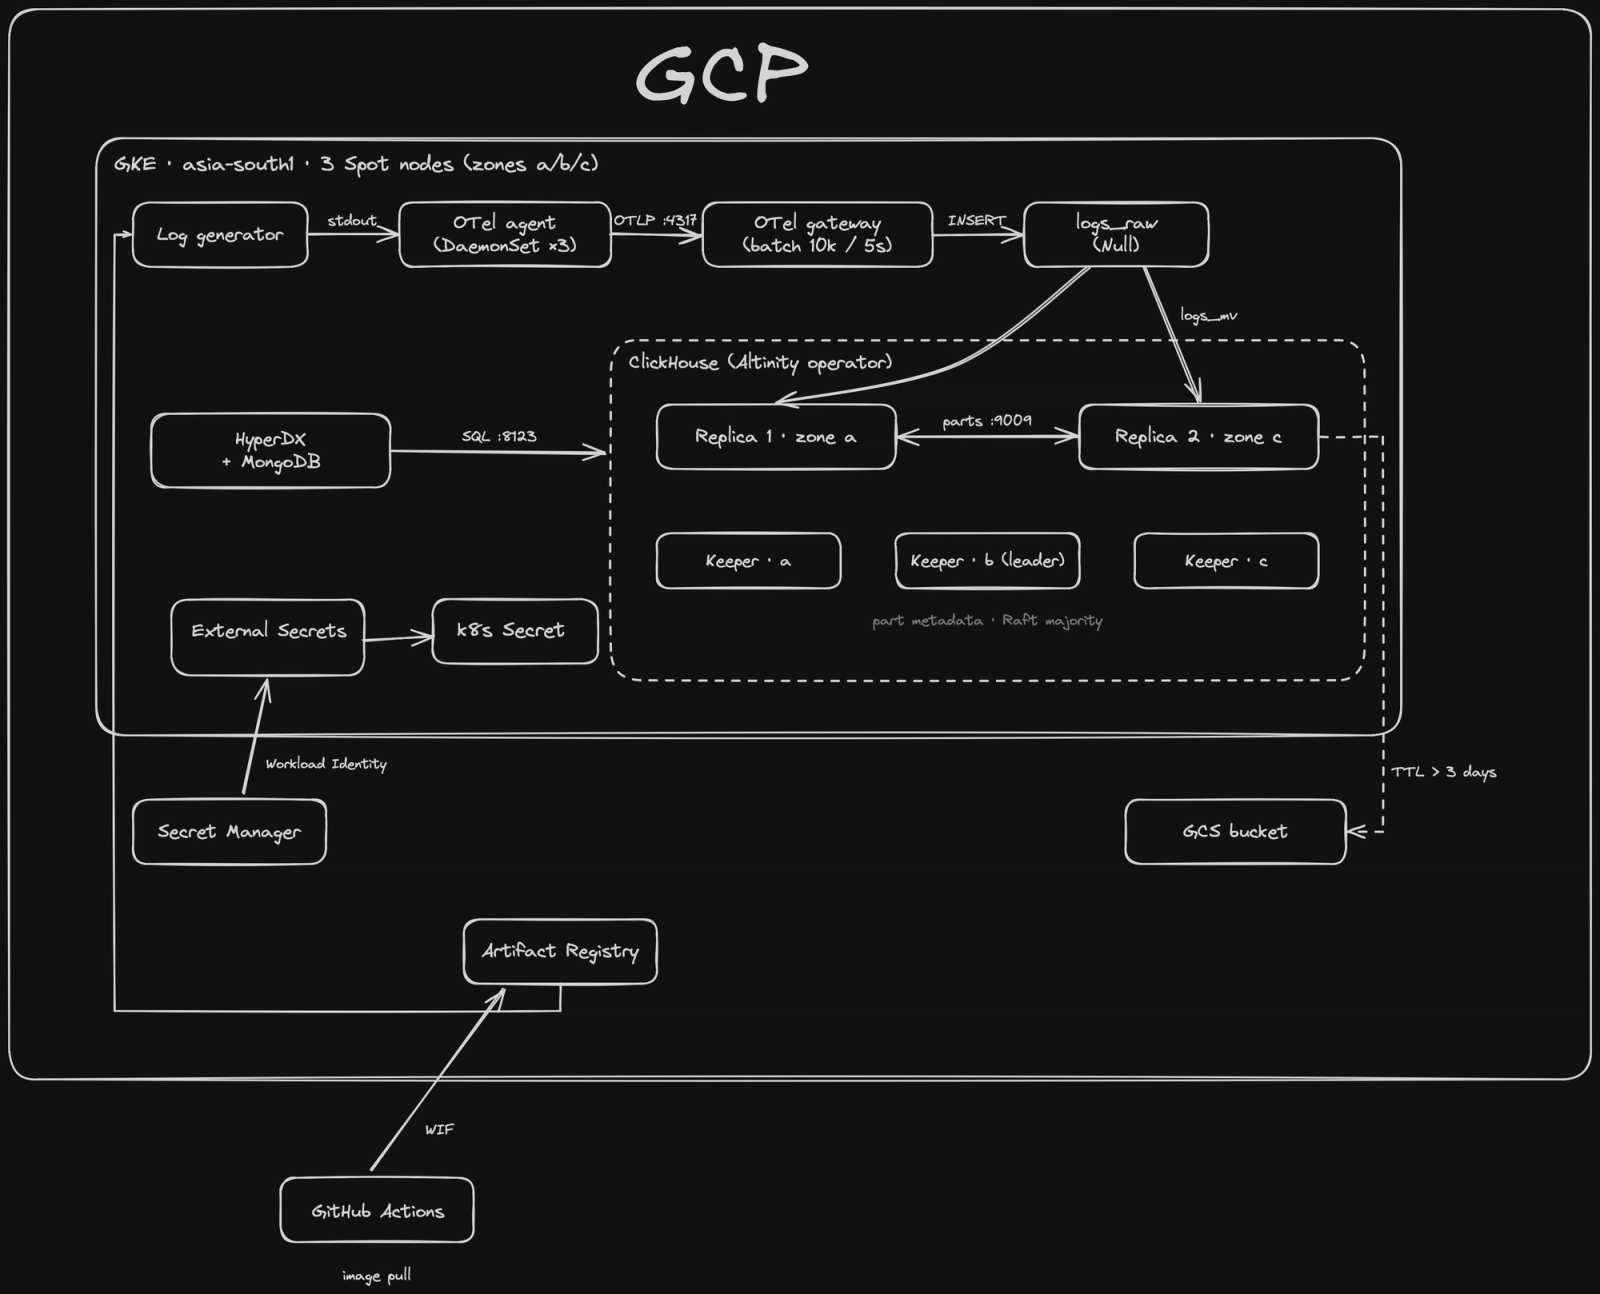
I built a small log platform to understand how ClickHouse-based observability stacks work end to end: ingestion, storage layout, replication and tiered storage. It runs on GKE in asia-south1 on three Spot nodes, one per zone. Every number in this post comes from that setup.
Components:
- A log generator: four services (api, auth, payments, worker) printing JSON to stdout.
INCIDENT=paymentsmakes payments return 5xx 40% of the time with 10x latency. - OpenTelemetry Collector as an agent (DaemonSet) and a gateway (Deployment).
- ClickHouse: one shard, two replicas, three Keepers, managed by the Altinity operator.
- GCS as a cold tier for parts older than three days.
- HyperDX with MongoDB for search.
- Terraform for GCP, GitHub Actions for the image, Secret Manager with External Secrets for credentials.
Ingestion
The application only writes to stdout. The container runtime writes it to /var/log/pods/<namespace>_<pod>_<uid>/<container>/*.log on the node. The agent runs on every node, tails those files, parses the JSON body into attributes, sets severity from level, drops lines without a service field, and forwards OTLP over gRPC to the gateway.
The gateway exists for batching. Every INSERT into a MergeTree table creates a new part on disk. Many small inserts produce parts faster than background merges can combine them, and ClickHouse eventually rejects writes with Too many parts. The gateway buffers until it has 10,000 records or 5 seconds have passed.
1processors:2 batch:3 send_batch_size: 100004 timeout: 5s56exporters:7 clickhouse:8 endpoint: tcp://clickhouse-loghouse:90009 logs_table_name: logs_raw10 create_schema: falseAt 50 logs/s this resulted in one insert every 5 seconds with about 250 rows each, visible in system.query_log.
One issue during setup: the agent first set resource.attributes["service.name"] from each log record. Records in a batch share a single resource, so every record overwrote it and the whole batch was attributed to the last service. Fix: copy the value to a record attribute and regroup records by it with groupbyattrs.
1transform/service_name:2 log_statements:3 - context: log4 statements:5 - set(attributes["service.name"], attributes["service"])6groupbyattrs/service:7 keys: [service.name]Schema
The gateway writes to logs_raw, which uses the Null engine. Nothing is stored. A materialized view on it parses and normalizes each inserted block and writes to app_logs. Raw data is never persisted twice.
1CREATE TABLE logs_raw ON CLUSTER main ( /* OTel exporter columns */ )2ENGINE = Null;34CREATE MATERIALIZED VIEW logs_mv ON CLUSTER main TO app_logs AS5SELECT6 Timestamp,7 ServiceName AS Service,8 lower(SeverityText) AS Level,9 JSONExtractString(Body, 'route') AS Route,10 toUInt16(JSONExtractUInt(Body, 'status')) AS Status,11 toUInt32(JSONExtractUInt(Body, 'duration_ms')) AS DurationMs,12 JSONExtractString(Body, 'trace_id') AS TraceId,13 JSONExtractString(Body, 'msg') AS Message14FROM logs_raw;1CREATE TABLE app_logs ON CLUSTER main2(3 Timestamp DateTime64(3) CODEC(Delta, ZSTD),4 Service LowCardinality(String),5 Level LowCardinality(String),6 Route LowCardinality(String),7 Status UInt16,8 DurationMs UInt32,9 TraceId String,10 Message String11)12ENGINE = ReplicatedMergeTree13PARTITION BY toDate(Timestamp)14ORDER BY (Service, Level, Timestamp)15TTL toDateTime(Timestamp) + INTERVAL 3 DAY TO VOLUME 'cold',16 toDateTime(Timestamp) + INTERVAL 30 DAY DELETE17SETTINGS storage_policy = 'hot_cold';A second materialized view on app_logs counts errors per service per minute into errors_per_minute (ReplicatedSummingMergeTree). Dashboards and alerts read this table instead of scanning raw logs.
A materialized view only sees the block being inserted. Each insert therefore writes its own partial count, and SummingMergeTree only collapses rows with the same key during background merges. Inserting the same three errors twice produced two rows of 3 for the same minute until a merge ran. The rollup has to be read with aggregation:
1SELECT Minute, Service, sum(Errors) AS errors2FROM errors_per_minute3GROUP BY Minute, Service;
Choosing the sort key
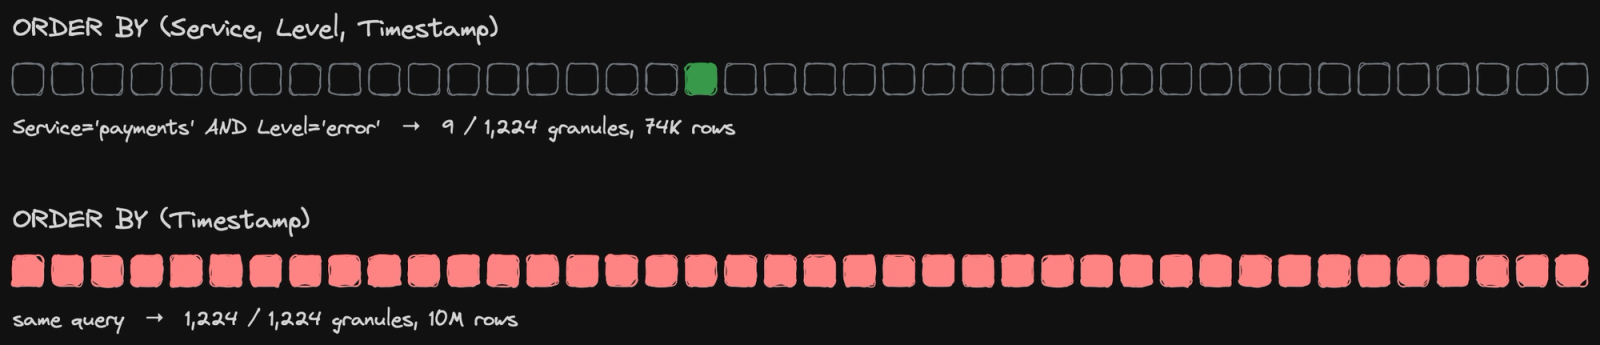
I loaded 10M synthetic rows into two tables that differed only in ORDER BY and ran the same queries against both.
1-- Service = 'payments' AND Level = 'error'2ORDER BY (Service, Level, Timestamp) 9 / 1,224 granules 74K rows read3ORDER BY (Timestamp) 1,224 / 1,224 granules 10M rows read45-- Timestamp > now() - INTERVAL 10 MINUTE6ORDER BY (Service, Level, Timestamp) 98K rows read7ORDER BY (Timestamp) 8K rows readThe primary index is sparse: one entry per granule of 8,192 rows. A filter on the leading key columns lets ClickHouse skip granules. A filter on a column that is not a key prefix reads everything (Condition: true in EXPLAIN).
Neither key is better in general. Incident triage filters by service and level first, so those lead the key, with Timestamp last for range scans within a service.
The sort order also affects compression. Measured per column in system.columns:
Level: 49 KiB when sorted by service and level, 3.2 MiB when sorted by time.TimestampwithCODEC(Delta, ZSTD): 19x.TraceId: 1x. Random hex does not compress, and this column was 89% of the table on disk.
Replication
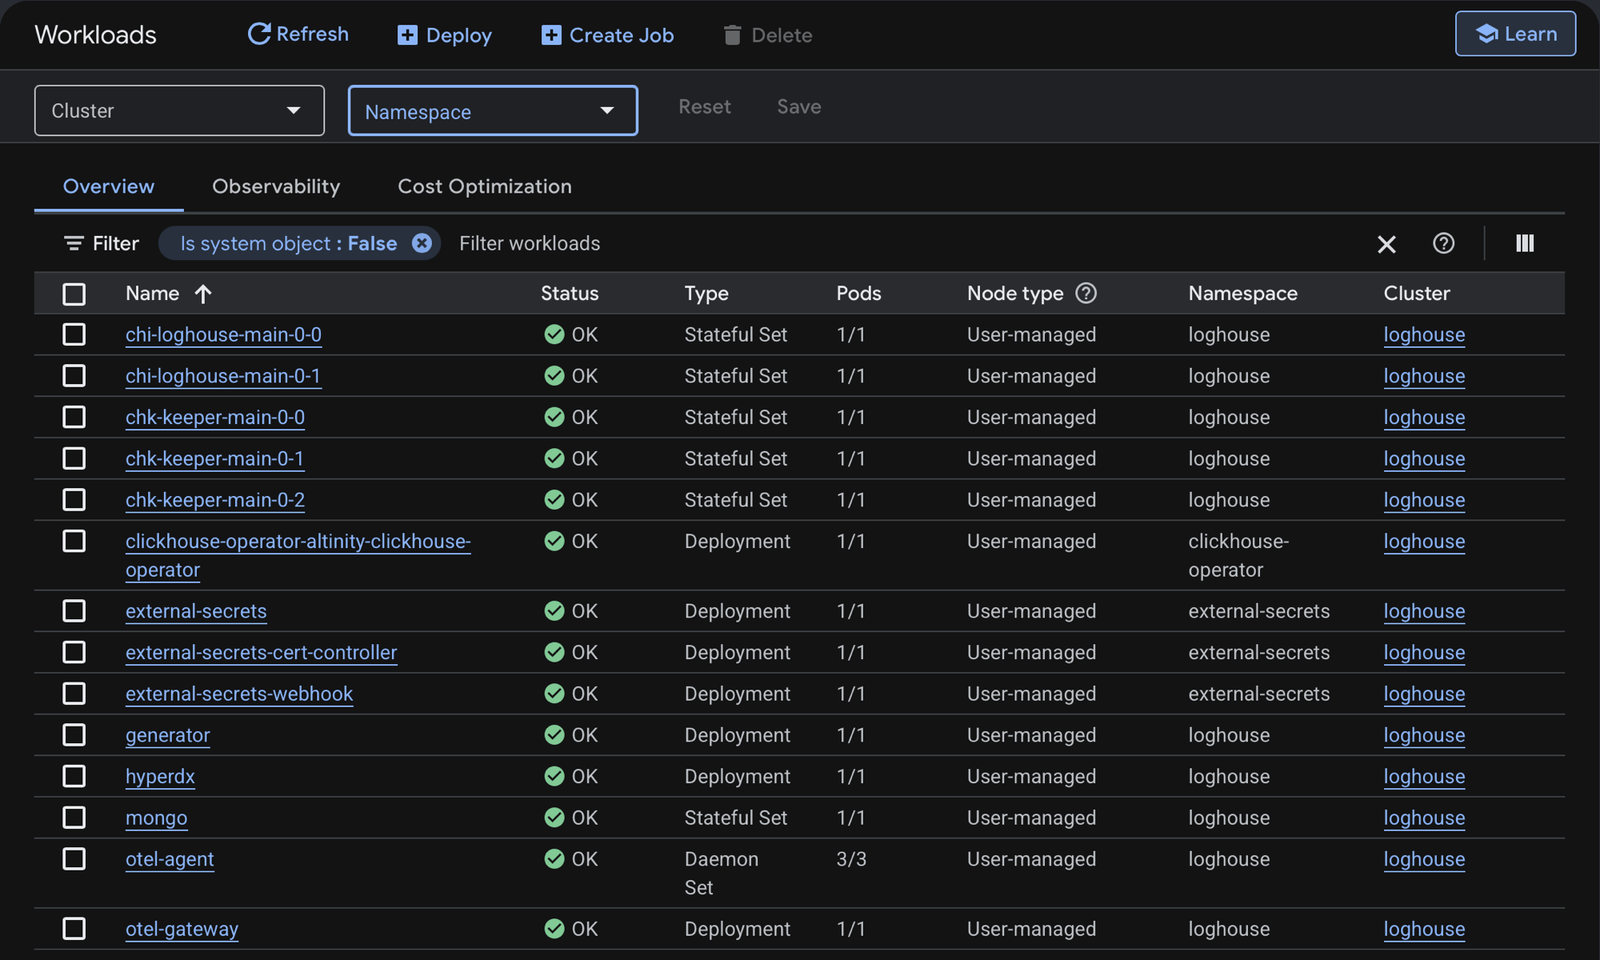
ClickHouse runs through the Altinity operator. A ClickHouseInstallation declares one shard with two replicas, a ClickHouseKeeperInstallation declares three Keepers, and the operator generates the StatefulSets, PVCs, services and cluster configuration. Pod anti-affinity on topology.kubernetes.io/zone keeps the replicas in different zones (a and c) and the Keepers in a, b and c.
With ReplicatedMergeTree, a replica that receives an insert writes the part locally and registers it in Keeper. The other replica sees the entry and fetches the part directly from its peer over the interserver port (9009). Keeper stores metadata only: parts, merge assignments and deduplication state.
Keeper uses Raft and needs a majority. Three is the minimum that tolerates one failure. With two, losing either one stops writes. With three, losing two leaves reads working and writes blocked.
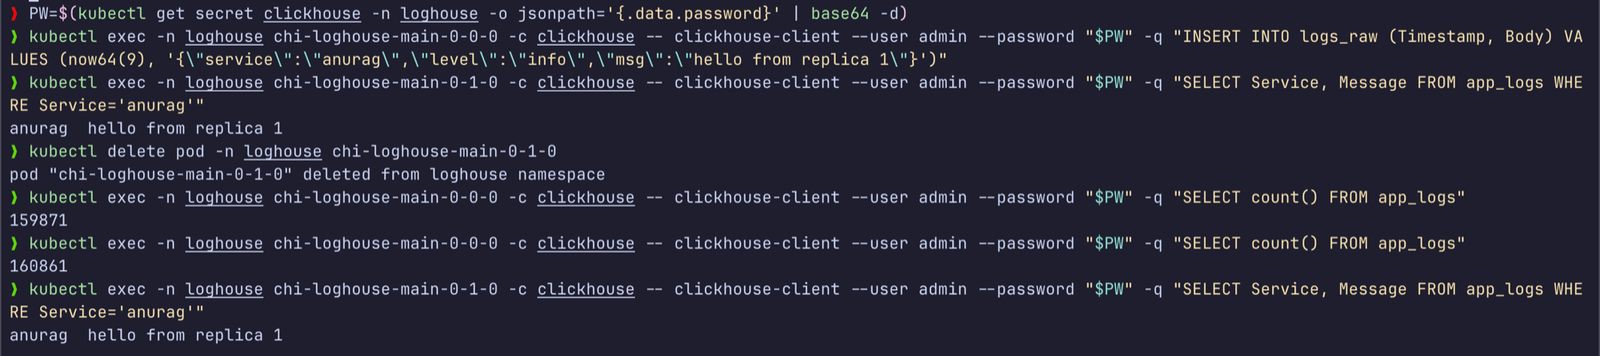
Failover test: delete the replica 2 pod, insert 1,000 rows into replica 1, wait for the pod to return. The StatefulSet recreated it with the same name and PVC, the replica fetched the missing parts listed in Keeper, and both replicas reported 1,003 rows. Ingestion continued during the outage because the gateway writes through a Service that resolves to whichever replicas are up.

Tiered storage
Logs are rarely read after a few days, so older parts move to GCS. ClickHouse uses GCS through its S3-compatible API with an HMAC key belonging to a service account that only has storage.objectAdmin on that bucket.
1<storage_configuration>2 <disks>3 <gcs>4 <type>s3</type>5 <endpoint>https://storage.googleapis.com/BUCKET/data/</endpoint>6 <access_key_id from_env="GCS_ACCESS_KEY_ID"/>7 <secret_access_key from_env="GCS_SECRET_ACCESS_KEY"/>8 <support_batch_delete>false</support_batch_delete>9 </gcs>10 </disks>11 <policies>12 <hot_cold>13 <volumes>14 <hot><disk>default</disk></hot>15 <cold><disk>gcs</disk></cold>16 </volumes>17 </hot_cold>18 </policies>19</storage_configuration>GCS does not implement the S3 multi-object delete call, so support_batch_delete must be disabled. A row inserted with a timestamp five days old was written directly to the gcs disk, and a normal query on the other replica returned it with _disk_name = gcs. Object names in the bucket are opaque; the mapping from parts to objects lives in local metadata on each replica.
Credentials and identity
No service account keys exist in this setup.
- Secret Manager holds the ClickHouse password and the HMAC key. External Secrets syncs them into one Kubernetes Secret hourly. Its Kubernetes service account is granted
secretmanager.secretAccessordirectly as a Workload Identity principal. - GitHub Actions pushes the generator image to Artifact Registry through Workload Identity Federation. The provider only accepts tokens where
assertion.repository == "intojhanurag/loghouse". - ClickHouse, the gateway and HyperDX read the password from the Kubernetes Secret via
secretKeyRef.
Issues during deployment
- Keepers were never created. The operator Helm chart's
watchNamespacesdefaults to the operator's own namespace. Setting it to the application namespace fixed it. - The installation aborted on operator 0.27.4, which removed the
k8s_secret_passwordsyntax. User passwords now usevalueFrom.secretKeyRef. The error was in the CHI status. - The agent failed with
type '<nil>' cannot be parsed as log path field. The container parser needs the file path to extract pod metadata; the filelog receiver requiresinclude_file_path: true.
Querying
HyperDX is pointed at app_logs with explicit column mappings (timestamp, service, severity, body), so it does not need the default OTel schema.
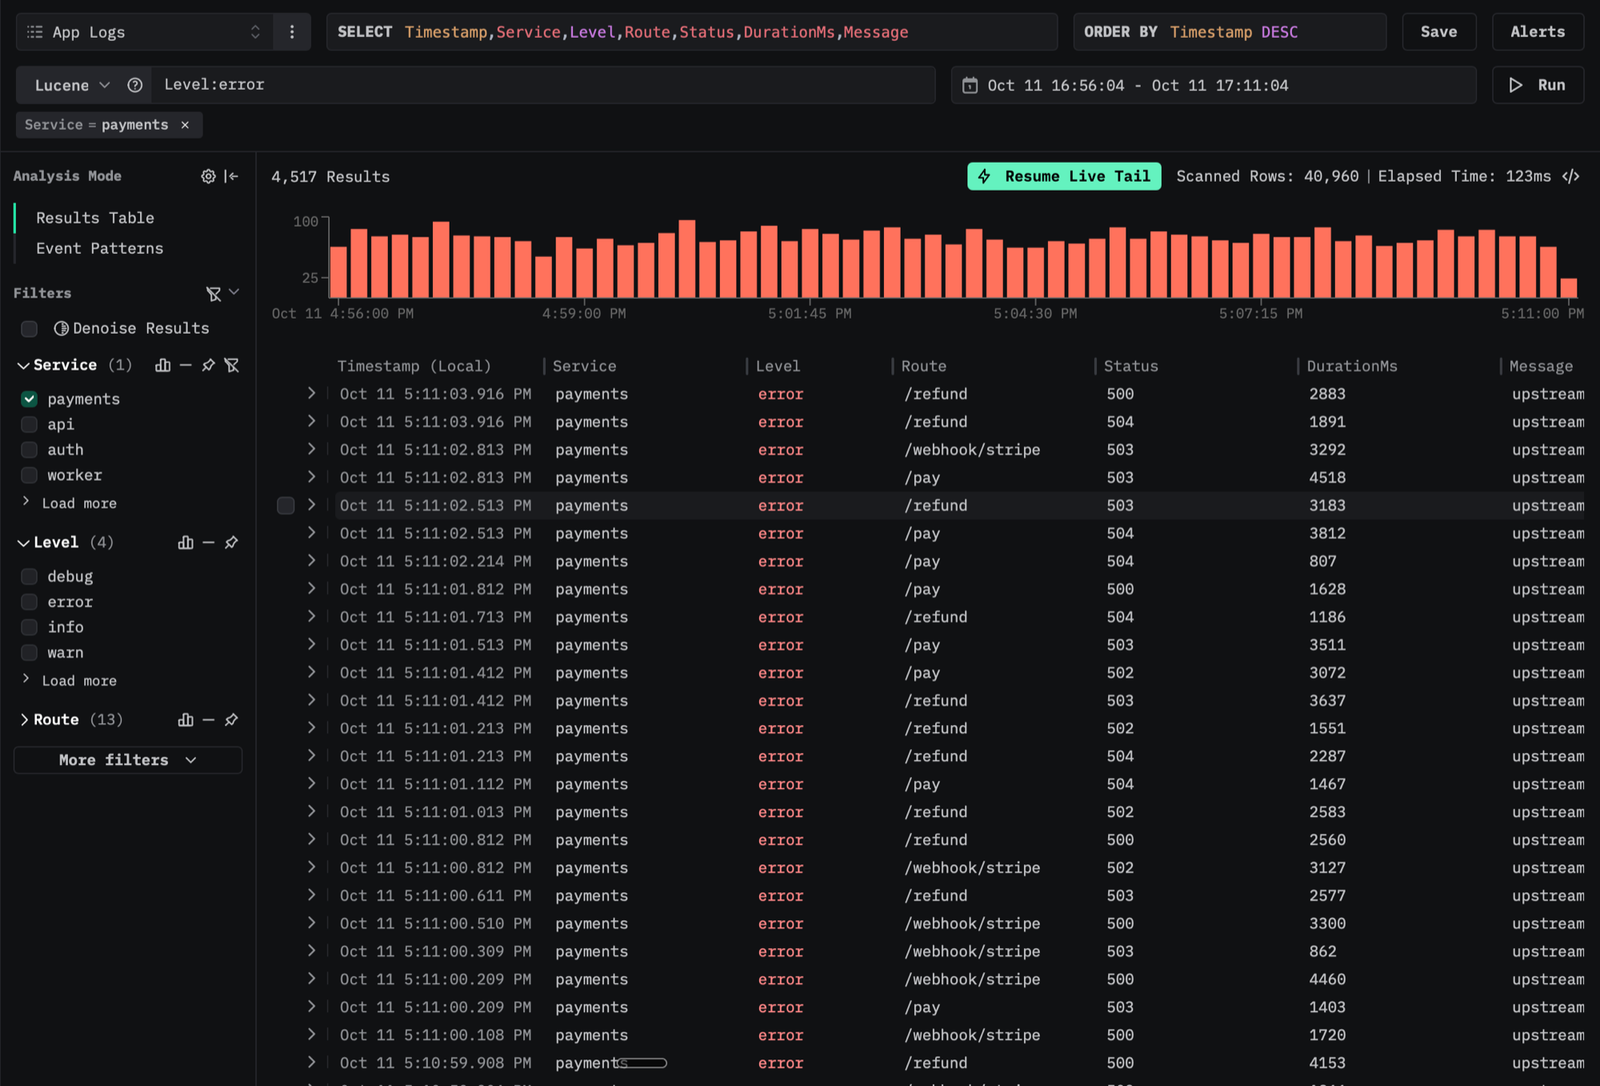
With INCIDENT=payments enabled, filtering on Level:error and grouping by service showed about 300 payments errors per minute against 2 to 3 for the other services, all 5xx, 1 to 4.5 s latency, message upstream timeout. The query returned 4,517 rows after scanning 40,960, which is exactly five granules out of more than 100K rows, because the filter matched the first two sort key columns.
Cost and trade-offs
The cluster costs roughly $3 to $5 per day, almost entirely the three Spot nodes and their disks. The zonal control plane is covered by the GKE free tier.
GKE already ships container stdout to Cloud Logging, which is free for the first 50 GiB per month and requires no setup. At small volume that is the right choice. Self-hosting ClickHouse makes sense when ingestion pricing grows with volume while compressed columnar storage, object-storage tiering and SQL aggregation keep cost and query time low.
Source code: github.com/intojhanurag/loghouse